Results
In the following, we present some figures and tables on different distribution frequencies, which are also found in Zahner, Schönhuber, Grijzenhout & Braun (2016).
Most of the words that are used by the mothers in the KIDS Corpus are verbs (23%), followed in frequency by pronouns (19%), adverbs (18%) and nouns (12%), see Figure 2. Within the 524 IPs, 832 words are accented. Thus, an IP contains 1.6 pitch accents on average. 41% of the words carry a pitch accent (832 out of 2014). In total, 26% of the accented words are nouns, 25% are verbs, 16% are adverbs, and 10% are adjectives, see Figure 2. Most of the accented words follow a typical Germanic word-prosodic structure: 52% are monosyllabic (S), followed in frequency by trochaic words (SW, 30%). Other structures are considerably less frequent (e.g., WS: 4%, SWW: 4%).
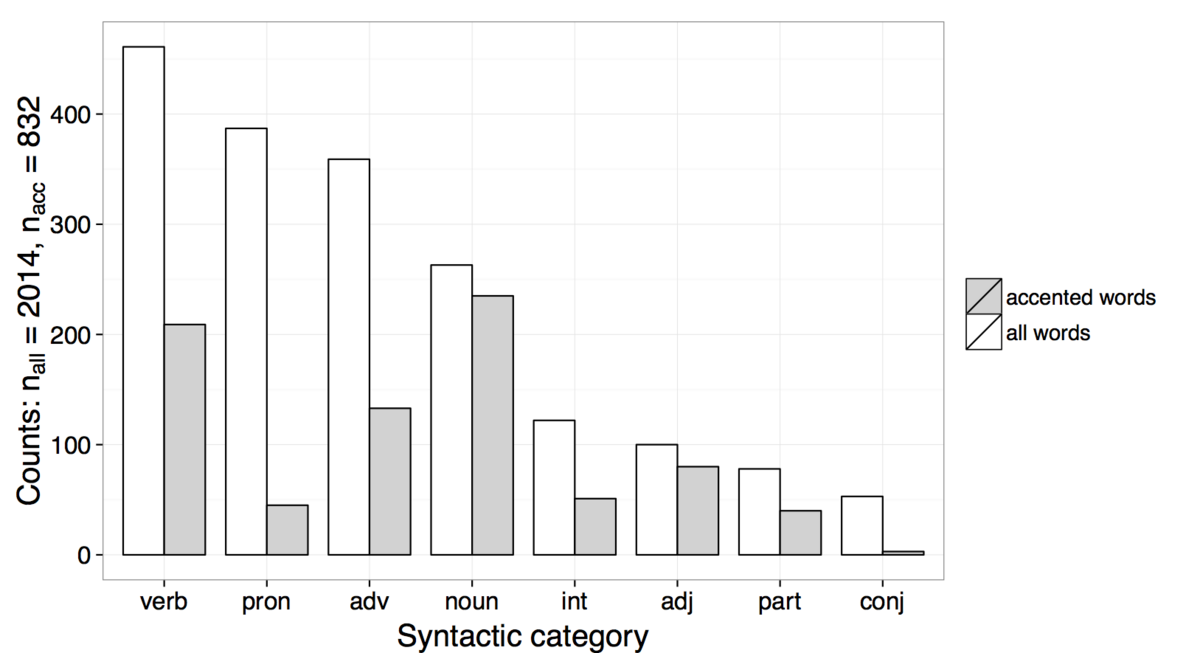
y-axis shows absolute counts.
Table 2 shows the distribution of boundary tones in the KIDS Corpus, Table 3 the distribution of pitch accents. The corpus comprises 524 initial and 524 final boundary tones. In the majority of cases, the utterances start with a low boundary tone (69% of the IPs). The most frequent final boundary tone is L-% (46% of the IPs). The next frequent patterns are a high plateau (H-%, 25%) and a low rise (L-H%, 13%). Incomplete falls (!H-%, 7%) and high rises (H-^H%, 7%) are least frequent.
Overall, the most frequent accent types are H* and L+H*, each occurring in more than 25% of the accents overall. The low-pitched monotonal accent (L*) are also common (18%). Note, however, that L* accents are often followed by a high tone, in particular a high boundary tone (see analysis of three-tone-sequences in Table 4). In the CHILDES recordings, L* accents are significantly more frequent than in the utterances recorded in our lab (25% vs. 13%; p=0.003 in a glmer with dataset as fixed factor and mother as crossed-random factor). Accents with a high leading tone (H+L*, H+!H*) are only sparsely represented in the corpus (6% and 2%, respectively).
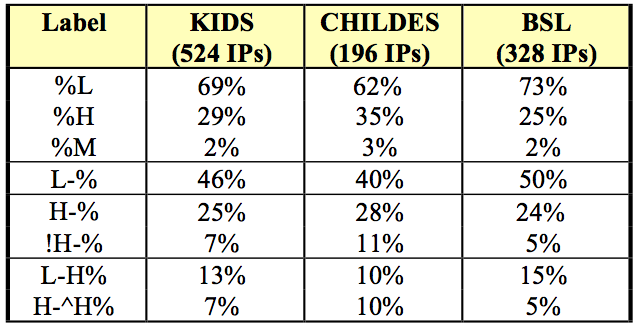
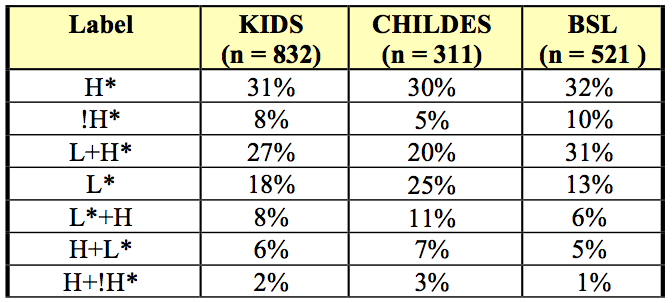
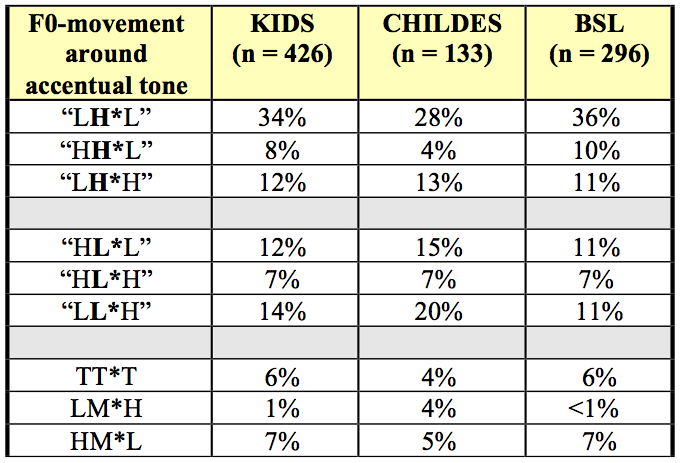
Table 4 shows the results for the three-tone-sequences in accents that are surrounded by at least one unaccented syllable on both sides, i.e., the 1a1-cases (see annotation on tier 9 in the TextGrid-file). For the sake of clarity, the results are simplified in two respects: First, Table 4 ignores scaling differences, i.e., an L+H* !H-% is counted as LH*L, see Figure 1. Second, it is not taken into account whether a preceding or following pitch target is associated with a syllable adjacent to the accented syllable or is realized later, i.e., an LH*..L notation is counted as LH*L here, see Figure 1. In total, the relevant 1a1-cases account for more than half of the data (426 accented syllables). By far the most frequent accentual pattern is a rising-falling movement (LH*L), which occurs in 34% of the cases. The second most common accentual pattern is LL*H. i.e., a low accentual tone preceded by a low and followed by a high tone, occurring in 14% of the cases. Regarding the three-tone-sequence LL*H in the 1a1-cases of our corpus, we again observed a distribution difference across the two subsets: LL*H patterns are significantly more frequent in the CHILDES subset than in the BSL recordings (20% vs. 11%, p=0.04 in a glmer with dataset as fixed factor and mother as crossed-random factor).